

Seven Weeks In: Overall AI Visibility Is Back Near Baseline, however the Information Landscape Has Changed
Seven weeks into the CiteCompass NZ Election 2026 AI Visibility Monitor, the overall level of measured political-party AI visibility is almost exactly where it began.
The average AI Visibility Score across the 30 monitored party-policy profiles was 10.0/100 in Week 7.
The Week 1 baseline was 9.9/100.
That means seven weeks of campaigning, policy announcements, media coverage and changing online information have produced only a 0.1-point increase in the overall measured average.
But that does not mean the information environment has remained unchanged.
Quite the opposite.
Underneath the aggregate number, the distribution of visibility across parties and policy domains has continued to shift.
In Week 7, exactly 10 profiles increased, 10 decreased and 10 were unchanged compared with Week 6. Those movements represented 77 points of absolute change across the 30 monitored profiles, while the overall dataset declined by only 11 points.
The policy domains also moved in markedly different directions.
Economy, Jobs & Growth reached its highest average of the seven-week study.
At the same time, Cost of Living and Health recorded their lowest averages so far, while Housing fell back to near-zero measured visibility.
The Week 7 picture is therefore increasingly clear:
Overall political-party AI visibility remains persistently low, while the location of that visibility continues to change.
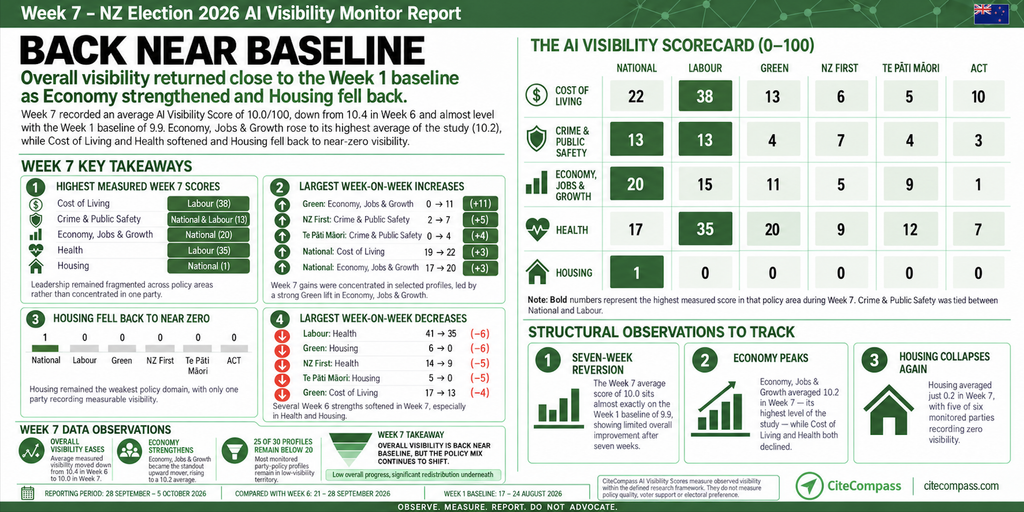
Week 7 reporting period: 28 September–5 October 2026 UTC.
AI Visibility Scores are CiteCompass research metrics measured on a 0–100 scale within the defined research framework. They measure observed visibility within generative AI research activity. They do not measure policy quality, electoral support or voter preference.
Visit the Interactive Data Report here
Week 7 at a Glance
| Measure | Week 7 |
|---|---|
| Average AI Visibility Score | 10 / 100 |
| Week 6 average | 10.37 |
| Week 1 baseline | 9.9 |
| Profiles below 20 | 25 / 30 — 83% |
| Profiles at 20 or above | 5 / 30 |
| Profiles recording zero | 5 |
| Highest measured Week 7 score | 38 |
| Profiles increasing vs Week 6 | 10 |
| Profiles decreasing vs Week 6 | 10 |
| Profiles unchanged | 10 |
| Combined absolute movement | 77 points |
The contrast between these measures is important.
The overall average declined from approximately 10.4 to 10.0, yet the number of profiles reaching 20 or above actually increased from three to five.
Visibility therefore did not simply contract uniformly.
It redistributed.
Week 7 Scorecard
| Policy domain | National | Labour | Green | NZ First | Te Pāti Māori | ACT |
|---|---|---|---|---|---|---|
| Cost of Living | 22 | 38 | 13 | 6 | 5 | 10 |
| Crime & Public Safety | 13 | 13 | 4 | 7 | 4 | 3 |
| Economy, Jobs & Growth | 20 | 15 | 11 | 5 | 9 | 1 |
| Health | 17 | 35 | 20 | 9 | 12 | 7 |
| Housing | 1 | 0 | 0 | 0 | 0 | 0 |
Important: Bold figures identify the highest measured AI Visibility Score within each policy-domain row. A tie is shown where applicable. These figures do not indicate policy quality, electoral support or voter preference.
Insight 1: Seven Weeks of Movement Have Left the Overall Average Almost Where It Started
The Week 1 average was 9.9.
The Week 7 average is 10.0.
Measured at the aggregate level, political-party AI visibility has therefore barely changed over seven weeks.
That headline, however, masks substantial movement.
Comparing the 30 Week 7 profiles directly with their Week 1 baseline values shows that 11 are higher, 13 are lower and six are unchanged.
Across those profiles there has been approximately 149 points of absolute movement, while the net movement across the complete dataset is only three points.
This is now one of the clearest findings of the longitudinal study.
A relatively stable overall AI Visibility Score does not mean the underlying AI information environment is stable.
The same overall average can be produced by substantially different combinations of party and policy visibility.
Seven weeks of data are increasingly allowing that distinction to be observed.
Insight 2: Economy, Jobs & Growth Reached a Seven-Week High
The most significant policy-domain increase in Week 7 occurred in Economy, Jobs & Growth.
Its average increased from 7.5 in Week 6 to 10.2 in Week 7, a gain of approximately 2.7 points.
That is also the highest Economy, Jobs & Growth domain average recorded during the seven weeks of the study.
| Party | Week 6 | Week 7 | Change |
|---|---|---|---|
| National | 17 | 20 | +3 |
| Labour | 14 | 15 | +1 |
| Green | 0 | 11 | +11 |
| NZ First | 5 | 5 | 0 |
| Te Pāti Māori | 8 | 9 | +1 |
| ACT | 1 | 1 | 0 |
| Domain average | 7.5 | 10.2 | +2.7 |
The largest individual increase anywhere in the Week 7 dataset occurred within this domain, with the Green profile moving from 0 to 11.
All six Economy, Jobs & Growth profiles also recorded measurable visibility in Week 7.
The result represents a notable change from Week 5, when the domain average was only 4.3.
It does not establish why the change occurred. The study is observational and does not attribute individual score movements to specific campaign announcements, website changes, media activity or AI-platform behaviour.
What the data establishes is that economic-policy information became materially more visible within the measured AI research environment during Week 7.
Insight 3: Cost of Living and Health Fell to Their Lowest Domain Averages So Far
While Economy, Jobs & Growth moved upward, the two historically strongest policy domains moved in the opposite direction.
Cost of Living decreased from 16.8 to 15.7.
Health decreased from 18.2 to 16.7.
Both are now at their lowest measured domain averages of the seven-week study.
The pattern is particularly significant because Cost of Living and Health have accounted for much of the higher measured visibility observed since the study began.
Cost of Living averaged 19.0 at the Week 1 baseline, reached 21.3 in Week 4, and has since declined to 15.7.
Health began at 18.3, has remained comparatively visible throughout the study, and now sits at 16.7.
Health nevertheless remains the highest-visibility policy domain in Week 7, followed closely by Cost of Living.
The distinction is important: these domains continue to generate more measurable visibility than the other areas, but their overall presence has reduced.
Insight 4: Housing Visibility Almost Disappeared
Housing produced the most pronounced domain-level contraction in Week 7.
Its average fell from 2.0 in Week 6 to just 0.2 in Week 7.
Five of the six monitored Housing profiles recorded a score of zero.
Only National recorded measurable Housing visibility, with a score of 1.
| Party | Week 6 | Week 7 | Change |
|---|---|---|---|
| National | 0 | 1 | +1 |
| Labour | 1 | 0 | -1 |
| Green | 6 | 0 | -6 |
| NZ First | 0 | 0 | 0 |
| Te Pāti Māori | 5 | 0 | -5 |
| ACT | 0 | 0 | 0 |
| Domain average | 2.0 | 0.2 | -1.8 |
This creates another notable Week 7 pattern.
There are still five zero-score profiles across the entire 30-profile dataset — the same number as Week 6.
But in Week 7 all five zeros are concentrated in Housing.
Housing has been the lowest-visibility policy domain throughout almost the entire study. Its seven-week domain averages are:
1.0 → 2.2 → 0.2 → 1.3 → 1.8 → 2.0 → 0.2
The Week 7 result therefore returns Housing almost exactly to the low point recorded in Week 3.
Insight 5: Crime & Public Safety Stayed Flat Overall While Visibility Shifted Between Profiles
Crime & Public Safety demonstrates again why averages alone can be misleading.
The domain average was 7.3 in Week 6.
It remained 7.3 in Week 7.
But the individual profiles moved substantially.
National declined from 17 to 13.
Labour increased from 11 to 13.
NZ First increased from 2 to 7.
Te Pāti Māori increased from 0 to 4.
ACT declined from 10 to 3.
Green remained unchanged at 4.
National and Labour therefore recorded an equal highest measured score of 13 within the domain.
The average did not move at all, yet the six profiles generated 22 points of absolute week-on-week movement.
Crime & Public Safety provides a compact example of the redistribution pattern that has become increasingly visible across the broader longitudinal dataset.
Policy-Domain Visibility Has Rotated
The Week 7 domain averages provide a useful view of where measurable AI visibility is currently concentrated.
| Policy domain | Week 6 | Week 7 | Change |
|---|---|---|---|
| Health | 18.2 | 16.7 | -1.5 |
| Cost of Living | 16.8 | 15.7 | -1.2 |
| Economy, Jobs & Growth | 7.5 | 10.2 | +2.7 |
| Crime & Public Safety | 7.3 | 7.3 | 0.0 |
| Housing | 2.0 | 0.2 | -1.8 |
This is arguably the most important Week 7 structural change.
Visibility has shifted away from three domains and toward Economy, Jobs & Growth, while Crime & Public Safety remained unchanged at aggregate level.
The overall average consequently tells only part of the story.
Seven-Week Average AI Visibility Trend
| Reporting week | Average AI Visibility Score |
|---|---|
| Week 1 | 9.9 |
| Week 2 | 9.5 |
| Week 3 | 10.2 |
| Week 4 | 11.1 |
| Week 5 | 10.4 |
| Week 6 | 10.4 |
| Week 7 | 10.0 |
Week 4 remains the highest overall measured average of the study at 11.1.
Since then, the aggregate score has gradually moved back toward the original baseline.
That does not mean the study has returned to the same information environment that existed in Week 1.
The profiles generating that average are different.
The policy-domain distribution is different.
And individual party-policy scores have moved substantially in both directions.
This is precisely why a longitudinal approach is important.
What Week 7 Shows
Seven weeks of observation are now producing a clearer separation between overall visibility and the distribution of visibility.
The headline average remains persistently low and has returned almost exactly to the Week 1 baseline.
But the policy landscape underneath it continues to reorganise.
Economy, Jobs & Growth has reached a seven-week high.
Cost of Living and Health have reached seven-week lows.
Housing has fallen back to near-zero visibility.
Crime & Public Safety is unchanged at domain level despite substantial movement among the individual profiles.
At the same time, 25 of the 30 monitored party-policy profiles remain below 20/100.
The central Week 7 finding can therefore be summarised as:
Seven weeks into the study, political-party AI visibility remains almost unchanged overall from the baseline, however where that visibility sits has changed substantially.
What the Data Does — and Does Not — Tell Us
AI Visibility Scores measure the observable presence of monitored political-policy information within the defined CiteCompass generative-AI research framework.
They do not measure whether a policy is good or bad.
They do not measure electoral support.
They do not measure voter sentiment.
They do not predict election outcomes.
And a higher AI Visibility Score should not be interpreted as evidence that a party or policy is more popular, more credible or more effective.
The study is also observational rather than a controlled experiment.
The online information environment can change because political parties publish or modify information, media coverage changes, government and institutional information changes, third-party sources change, and generative AI platforms and models themselves evolve.
For that reason, CiteCompass reports what changed in the measured environment without claiming that a particular campaign action, policy announcement, media event or technical change caused an individual score movement.
Our Governing Research Principle
Observe. Measure. Report. Do not advocate.
The CiteCompass NZ Election 2026 AI Visibility Monitor does not assess the merits of political policies, recommend how New Zealanders should vote, endorse or oppose political parties or candidates, predict election outcomes or measure voter preference.
CiteCompass remains politically independent and applies the same research architecture and measurement methodology across all six monitored parties.
About the NZ Election 2026 AI Visibility Monitor
The CiteCompass NZ Election 2026 AI Visibility Monitor is an independent 12-week longitudinal observational study examining how leading generative AI platforms surface, represent and cite publicly available political-policy information during the lead-up to the 2026 New Zealand General Election.
The study monitors six parliamentary political parties across five policy domains: Cost of Living; Economy, Jobs & Growth; Health; Housing; and Crime & Public Safety.
Thirty party-policy profiles are measured each week using an equivalent research framework, monitoring cadence and measurement methodology.
The study measures information visibility. It does not assess political merit.
Political Independence
CiteCompass is politically independent.
The research does not assess which political party has the best policies, endorse or oppose a political party or candidate, recommend how New Zealanders should vote, predict election results, constitute political polling, measure voter sentiment or claim that AI visibility determines voter behaviour.
CiteCompass reports measured changes in how publicly available political information is represented, surfaced, sourced and cited within generative AI systems. (CiteCompass)
CiteCompass has also stated that it will not provide AI-visibility optimisation services to any monitored political party or candidate for the duration of the research programme. (CiteCompass)
Research Information
Week 1 baseline: Research commenced 25 August 2026
Week 7 reporting period: 28 September–5 October 2026 UTC.
Study duration: 12 weeks
Profiles monitored: 30 party-policy combinations
Methodology: Version 1.0
Research and Media Enquiries
Journalists, researchers, political parties and other interested parties are welcome to contact CiteCompass regarding the research framework, methodology, published findings or objective factual corrections.