

Portfolio Visibility Shifts Continue While Housing Returns to Near-Zero Visibility
Week 3 of the CiteCompass NZ Election 2026 AI Visibility Monitor recorded further movement across the political AI information landscape.
Labour recorded the highest measured visibility in Cost of Living at 36/100 and Economy, Jobs & Growth at 14/100. National recorded the highest measured visibility in Health at 34/100 and Crime & Public Safety at 16/100.
Several individual party-policy profiles moved materially compared with Week 2. National’s Health visibility increased from 20 to 34, while Labour increased from 26 to 36 in Cost of Living and from 0 to 10 in Crime & Public Safety. The Green Party increased from 2 to 12 in Economy, Jobs & Growth.
At the same time, Housing returned to near-zero measured political-party visibility, with five of the six monitored parties recording 0/100.
The Week 3 results reinforce an emerging feature of the study:
AI visibility is changing materially within individual policy areas, while overall political-party visibility remains relatively low.
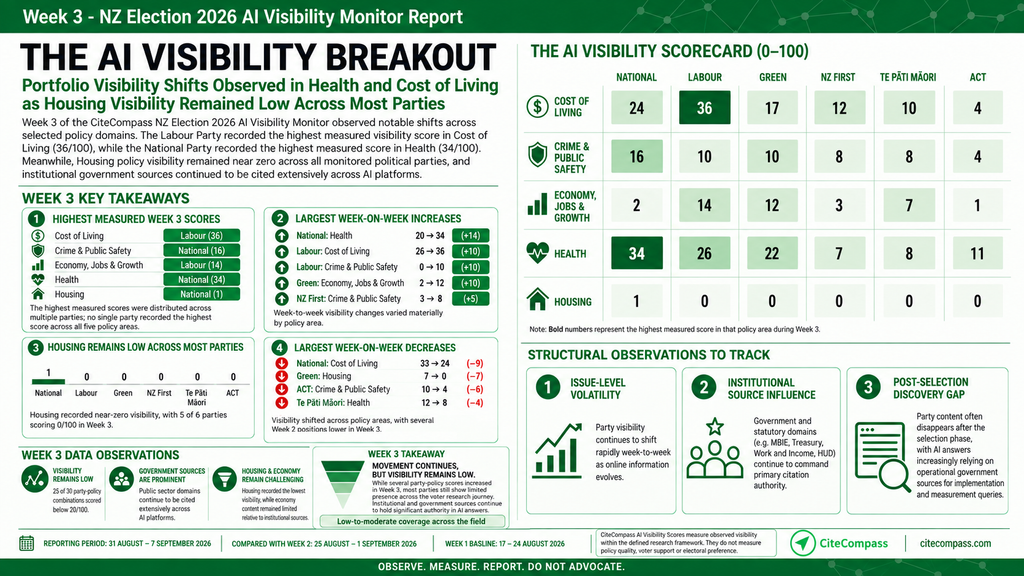
Week 3 — NZ Election 2026 AI Visibility Monitor. Reporting period: 31 August–7 September 2026 UTC. AI Visibility Scores are CiteCompass research metrics measured on a 0–100 scale within the defined research framework.
Summary of Week 3 Findings
Across the six parliamentary parties and five policy areas monitored:
- 30 party-policy combinations were measured.
- 25 of 30 recorded AI visibility scores below 20/100.
- 5 combinations recorded a visibility score of 0/100, all within Housing.
- 36/100 was the highest individual Week 3 visibility score, recorded by Labour in Cost of Living.
- National recorded the largest week-on-week increase, with Health moving from 20 to 34 (+14).
- Labour increased from 26 to 36 (+10) in Cost of Living and from 0 to 10 (+10) in Crime & Public Safety.
- The Green Party increased from 2 to 12 (+10) in Economy, Jobs & Growth.
- Housing recorded the lowest overall visibility, with National at 1/100 and the other five parties at 0/100.
- Government and institutional sources continued to feature prominently within the monitored AI information environment.
Across all 30 party-policy combinations, average measured visibility increased from 9.5 in Week 2 to 10.2 in Week 3.
This modest overall increase masks substantial movement within individual policy areas.
The Week 3 Visibility Scorecard
The following table displays the comparative AI Visibility Scores (0–100) across all six parliamentary political parties and five policy domains for Week 3.
| Policy Area | National | Labour | Green | NZ First | Te Pāti Māori | ACT |
|---|---|---|---|---|---|---|
| Cost of Living | 24 | 36 | 17 | 12 | 10 | 4 |
| Crime & Public Safety | 16 | 10 | 10 | 8 | 8 | 4 |
| Economy, Jobs & Growth | 2 | 14 | 12 | 3 | 7 | 1 |
| Health | 34 | 26 | 22 | 7 | 8 | 11 |
| Housing | 1 | 0 | 0 | 0 | 0 | 0 |
Bold numbers represent the highest measured score in that policy area during Week 3.
Insight 1: The Highest Measured Scores Remain Distributed Across Parties
No single political party recorded the highest measured visibility across all five policy areas.
The highest Week 3 scores were:
- Cost of Living — Labour: 36
- Crime & Public Safety — National: 16
- Economy, Jobs & Growth — Labour: 14
- Health — National: 34
- Housing — National: 1
The more significant finding remains the absolute level of visibility.
Only five of the 30 party-policy combinations recorded scores of 20 or higher. Twenty-five remained below 20.
This continues the pattern seen during the first two weeks: individual party-policy profiles can achieve materially higher visibility, but broad political-party presence across the monitored AI information environment remains limited.
Insight 2: Health Records the Largest Individual Week-on-Week Increase
Health produced the largest individual movement recorded in Week 3.
National increased from 20 to 34 (+14).
The complete Week 3 Health scores were:
National 34 | Labour 26 | Green 22 | ACT 11 | Te Pāti Māori 8 | NZ First 7
Other Health movements were more modest:
- Labour: 28 → 26 (-2)
- Green: 24 → 22 (-2)
- NZ First: 6 → 7 (+1)
- Te Pāti Māori: 12 → 8 (-4)
- ACT: 13 → 11 (-2)
National’s Week 3 result represents a substantial measured change within the research framework.
It does not indicate policy quality, electoral support or political effectiveness. It means information associated with National’s Health profile was more visible within the AI research activity measured during Week 3 than during Week 2.
Subsequent monitoring will determine whether this higher level persists.
Insight 3: Cost of Living Remains One of the Most Visible Policy Areas
Cost of Living continued to record comparatively high political-party visibility.
Week 3 scores were:
Labour 36 | National 24 | Green 17 | NZ First 12 | Te Pāti Māori 10 | ACT 4
The largest movement was Labour, increasing from 26 to 36 (+10).
Other movements were:
- National: 33 → 24 (-9)
- Green: 19 → 17 (-2)
- NZ First: 11 → 12 (+1)
- Te Pāti Māori: 10 → 10 (no change)
- ACT: 5 → 4 (-1)
The average Cost of Living visibility score changed only slightly, from 17.3 in Week 2 to 17.2 in Week 3.
This illustrates an important characteristic of the data: substantial movements can occur between individual parties even when the overall visibility of the policy domain remains relatively stable.
Insight 4: Economy, Jobs & Growth Records Broader Measured Visibility
Economy, Jobs & Growth showed one of the clearest overall increases at the policy-domain level with average visibility increased from 3.7 in Week 2 to 6.5 in Week 3. The largest movements were:
- Green: 2 → 12 (+10)
- Te Pāti Māori: 0 → 7 (+7)
- NZ First: 0 → 3 (+3)
- Labour: 13 → 14 (+1)
- National: 3 → 2 (-1)
- ACT: 4 → 1 (-3)
While Economy recorded broader political-party presence than in Week 2, absolute visibility remained relatively low.
Government and institutional information also continued to feature prominently. Within the Week 3 research, MBIE recorded 175 observed citations in economic queries.
This does not establish that institutional sources caused individual party visibility results. It does demonstrate that political-party information exists within a wider information ecosystem containing highly visible government and institutional sources.
Insight 5: Crime & Public Safety Records Broad-Based Movement
Crime & Public Safety also recorded increased visibility at the policy-domain level. The average score increased from 7.2 in Week 2 to 9.3 in Week 3. Week 3 scores were:
National 16 | Labour 10 | Green 10 | NZ First 8 | Te Pāti Māori 8 | ACT 4
Week-on-week movements were:
- National: 15 → 16 (+1)
- Labour: 0 → 10 (+10)
- Green: 8 → 10 (+2)
- NZ First: 3 → 8 (+5)
- Te Pāti Māori: 7 → 8 (+1)
- ACT: 10 → 4 (-6)
Five of the six monitored parties therefore recorded increases in this policy area, while ACT recorded a decrease.
Government sources also remained prominent within the surrounding information environment, with the Ministry of Justice recording more than 200 observed citations across monitored public-safety research.
The results again demonstrate that AI visibility can change substantially from one reporting period to another.
Three weeks of observations remain insufficient to determine whether individual movements represent sustained trends.
Insight 6: Housing Returns to Near-Zero Visibility
Housing recorded the clearest decline at the overall policy-domain level. Average measured visibility fell from 2.2 in Week 2 to 0.2 in Week 3. The Week 3 scores were:
National 1 | Labour 0 | Green 0 | NZ First 0 | Te Pāti Māori 0 | ACT 0
Week-on-week movements were:
- National: 5 → 1 (-4)
- Labour: 1 → 0 (-1)
- Green: 7 → 0 (-7)
- NZ First: 0 → 0
- Te Pāti Māori: 0 → 0
- ACT: 0 → 0
Five of the six parties therefore recorded zero measured visibility.
Political-party information remained minimally represented within this part of the monitored AI information environment, while public-sector housing sources continued to feature within relevant answers.
Housing has now emerged as the clearest example of a policy area where political-party AI visibility can remain extremely limited despite measurable movement elsewhere.
Week 3 Visibility by Policy Area
Looking across all six parties, average measured visibility was:
| Policy Area | Week 2 Average | Week 3 Average | Change |
|---|---|---|---|
| Health | 17.2 | 18.0 | +0.8 |
| Cost of Living | 17.3 | 17.2 | -0.2 |
| Crime & Public Safety | 7.2 | 9.3 | +2.2 |
| Economy, Jobs & Growth | 3.7 | 6.5 | +2.8 |
| Housing | 2.2 | 0.2 | -2.0 |
Health recorded the highest average political-party visibility in Week 3, closely followed by Cost of Living.
Crime & Public Safety and Economy both increased, while Housing moved back towards near-zero visibility.
The continuing variation between policy domains reinforces one of the central observations of the study: AI visibility appears highly dependent on the information environment surrounding the particular subject being researched.
What Week 3 Tells Us and What It Does Not
Three weeks of observations are beginning to demonstrate meaningful variability within individual party-policy profiles. However, these changes should not be interpreted as measures of political performance.
The study does not establish that:
- a higher AI visibility score means a better policy;
- a lower score means a weaker policy;
- greater visibility indicates greater electoral support;
- changes in visibility represent changes in voter intention;
- a visibility movement was caused by any single policy announcement, campaign activity or source; or
- the Week 3 positions will persist.
CiteCompass measures observable information presence, source visibility, citations and related characteristics within generative AI systems.
It does not measure electoral popularity or voter sentiment.
The Emerging Longitudinal Picture
Week 1 established the study’s baseline.
Week 2 demonstrated substantial movement within individual policy areas.
Week 3 provides further evidence that AI visibility is dynamic rather than fixed.
Three characteristics now warrant continued observation:
1. Issue-Level Volatility
Individual party-policy scores can change materially from one reporting period to another.
The study will continue to observe whether these movements persist, reverse or stabilise.
2. Institutional Source Influence
Government and other institutional sources continue to feature extensively within monitored AI answers.
The research will continue tracking the relative presence of party-owned information and third-party sources.
3. Persistent Low Visibility in Some Policy Areas
Housing remains the clearest example.
Despite movement elsewhere, political-party Housing information recorded almost no measurable visibility in Week 3.
How that position changes as the election information environment develops will be an important part of the remaining longitudinal research.
Our Governing Research Principle
The study does not assess the merits of political policies, recommend how New Zealanders should vote, predict election outcomes or measure voter sentiment.
Observe. Measure. Report. Do not advocate.
CiteCompass has consulted the New Zealand Electoral Commission regarding the structure and publication of this research initiative and is conducting the study in accordance with the guidance received.
About the NZ Election 2026 AI Visibility Monitor
The CiteCompass NZ Election 2026 AI Visibility Monitor is an independent 12-week longitudinal observational study examining how leading generative AI platforms surface, represent and cite publicly available political-policy information during the lead-up to the 2026 New Zealand General Election.
The study covers six parliamentary political parties across five policy domains:
- Cost of Living
- Economy, Jobs and Growth
- Health
- Housing
- Crime and Public Safety
All parties are monitored using an equivalent research architecture, profile framework, dynamic-query methodology, AI-platform framework, monitoring cadence, measurement framework, data-retention process, QA process and reporting methodology.
Individual research queries may change over time as part of CiteCompass’s dynamic methodology designed to model changing information needs and the evolving election information environment.
The study is observational rather than a controlled experiment.
Political Independence
CiteCompass is politically independent.
This research:
- does not assess which political party has the best policies;
- does not endorse or oppose any political party or candidate;
- does not recommend how New Zealanders should vote;
- does not predict election results;
- does not constitute political polling;
- does not measure voter sentiment; and
- does not claim that AI visibility determines voter behaviour.
CiteCompass reports measured changes in how publicly available political information is represented, surfaced, sourced and cited within generative AI systems.
Explore the Research
NZ Election 2026 AI Visibility Monitor & Methodology
[Add link to Methodology page]
Week 1 — Baseline Report
Week 2 — AI Visibility Report
Research Information
Week 3 reporting period: 31 August–7 September 2026 UTC
Study duration: 12 weeks
Methodology version: 1.0
Research and Media Enquiries
Journalists, researchers, political parties and other interested parties may contact CiteCompass regarding the research framework, methodology, published findings or objective factual corrections.
CiteCompass [email protected]