

AI Visibility Edges Higher, but 88 Points of Movement Reveal a Changing Landscape
Nine weeks into the CiteCompass NZ Election 2026 AI Visibility Monitor, overall measured political-party AI visibility has increased slightly, but remains close to its original baseline.
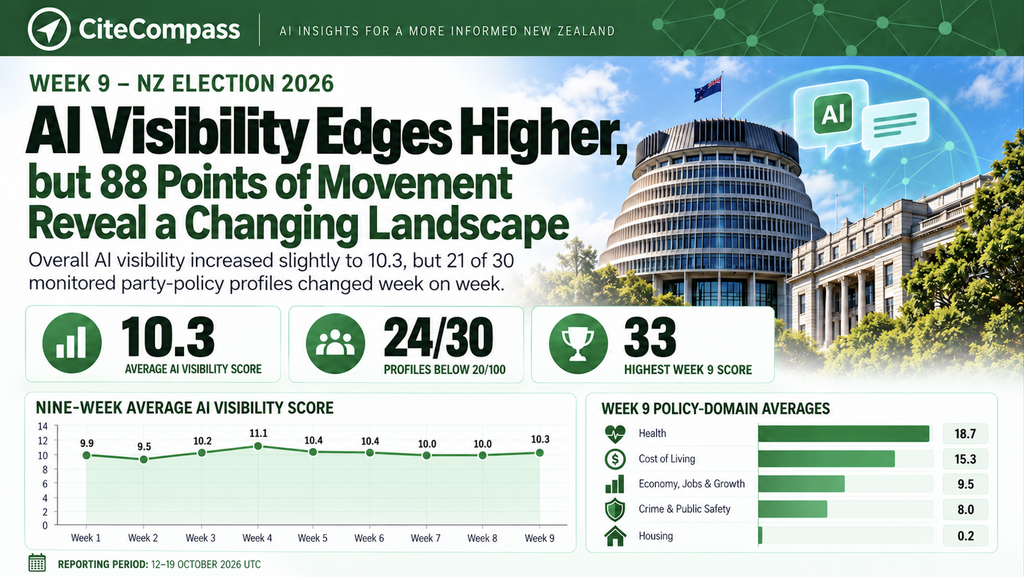
The average AI Visibility Score across the 30 monitored party-policy profiles rose from 10.0/100 in Week 8 to 10.3/100 in Week 9.
That modest increase masks considerable movement within the underlying data.
Across the 30 profiles, nine increased, 12 decreased and nine remained unchanged. Together, those changes represented 88 points of absolute week-on-week movement, while the net increase across the complete dataset was just 10 points.
The policy domains also moved in different directions.
Crime & Public Safety recorded the largest increase in average visibility, while Economy, Jobs & Growth also increased. Health and Cost of Living declined, with the latter reaching its lowest domain average of the nine-week study.
Housing remained almost invisible, with five of the six monitored profiles recording zero.
The Week 9 results reinforce a consistent finding from the longitudinal research:
Overall political-party AI visibility remains low, while substantial changes continue to occur in which party-policy information AI systems surface across different policy domains.
Week 9 reporting period: 12–19 October 2026 UTC.
Visit the Interactive Data Report here
AI Visibility Scores are CiteCompass research metrics measured on a 0–100 scale within the defined research framework. They measure observed visibility within generative AI research activity. They do not measure policy quality, electoral support or voter preference.
Week 9 at a Glance
| Measure | Week 9 |
|---|---|
| Average AI Visibility Score | 10.3 / 100 |
| Week 8 average | 10.0 |
| Week 1 baseline | 9.9 |
| Change vs Week 8 | +0.3 points |
| Profiles below 20 | 24 / 30 — 80% |
| Profiles at 20 or above | 6 / 30 |
| Profiles recording zero | 5 |
| Highest measured Week 9 score | 33 |
| Profiles increasing vs Week 8 | 9 |
| Profiles decreasing vs Week 8 | 12 |
| Profiles unchanged | 9 |
| Combined absolute movement | 88 points |
The contrast between these measures is important.
While the overall average increased by approximately one-third of a point, 21 of the 30 monitored profiles changed.
The number of profiles reaching 20 or above increased from five in Week 8 to six in Week 9. The highest individual score also increased from 30 to 33.
However, the overall average remains only 0.4 points above the Week 1 baseline.
The findings therefore continue to suggest redistribution of visibility between monitored profiles rather than broad-based, sustained growth.
Week 9 Scorecard
The following table shows the measured AI Visibility Score for each of the 30 monitored party-policy profiles.
| Policy domain | National | Labour | Green | NZ First | Te Pāti Māori | ACT |
|---|---|---|---|---|---|---|
| Cost of Living | 33 | 26 | 15 | 9 | 6 | 3 |
| Crime & Public Safety | 15 | 1 | 13 | 4 | 6 | 9 |
| Economy, Jobs & Growth | 10 | 11 | 21 | 2 | 7 | 6 |
| Health | 21 | 26 | 30 | 9 | 10 | 16 |
| Housing | 0 | 0 | 0 | 1 | 0 | 0 |
Important: Bold figures identify the highest measured AI Visibility Score within each policy-domain row. These figures do not indicate policy quality, electoral support or voter preference.
Insight 1: Overall Visibility Increased Slightly Despite 88 Points of Movement
The Week 8 average was 10.0.
The Week 9 average increased to 10.3.
Although this represents a modest increase, the underlying changes were much larger than the overall score suggests.
Nine profiles increased, 12 decreased and nine remained unchanged.
The absolute value of those movements totalled 88 points, compared with 106 points between Weeks 7 and 8.
This means the scale of week-on-week movement decreased, but remained substantial.
The overall dataset increased by only 10 points because changes across individual profiles largely offset one another.
The longer-term comparison is equally revealing.
Relative to the Week 1 baseline:
- 13 profiles now record higher visibility scores.
- 12 profiles record lower scores.
- Five profiles remain unchanged.
- The combined absolute difference across all 30 profiles is 137 points.
Yet the overall average has increased by only approximately 0.4 points since the study began.
This reinforces one of the most consistent findings of the research:
The overall level of AI visibility and the distribution of that visibility are two different measures of the information environment.
A relatively stable average can coexist with considerable variation in which party-policy profiles are being surfaced.
Insight 2: Crime & Public Safety Recorded the Largest Increase
Crime & Public Safety experienced the largest increase in average AI visibility during Week 9.
Its domain average rose from 5.5 in Week 8 to 8.0 in Week 9, an increase of 2.5 points.
This followed a decline from 7.3 to 5.5 in the previous reporting period.
The individual profile movements were substantial.
| Party | Week 8 | Week 9 | Change |
|---|---|---|---|
| National | 13 | 15 | +2 |
| Labour | 5 | 1 | -4 |
| Green | 0 | 13 | +13 |
| NZ First | 3 | 4 | +1 |
| Te Pāti Māori | 10 | 6 | -4 |
| ACT | 2 | 9 | +7 |
| Domain average | 5.5 | 8.0 | +2.5 |
The largest change occurred in the Green Party’s Crime & Public Safety profile, which increased from zero to 13.
ACT also recorded a sizeable increase, moving from 2 to 9.
National increased from 13 to 15, while NZ First moved from 3 to 4.
In contrast, Labour and Te Pāti Māori each declined by four points.
Importantly, all six Crime & Public Safety profiles recorded non-zero visibility in Week 9, compared with five in Week 8.
The result illustrates how the AI information environment can change considerably within a single policy domain, without those changes occurring uniformly across all parties.
The increase is an observation of measured AI visibility, not evidence that any party’s crime policies have become more effective, more popular or more persuasive.
Insight 3: Economy and Health Recorded Significant Redistribution Between Profiles
Two other policy domains demonstrated substantial movement beneath their overall averages.
Economy, Jobs & Growth increased from 8.7 to 9.5, while Health declined slightly from 19.0 to 18.7.
However, the changes between individual profiles were more pronounced than either domain average suggests.
The three largest positive movements across all 30 monitored profiles occurred in Green Party profiles.
| Policy domain | Week 8 | Week 9 | Change |
|---|---|---|---|
| Green — Crime & Public Safety | 0 | 13 | +13 |
| Green — Economy, Jobs & Growth | 10 | 21 | +11 |
| Green — Health | 22 | 30 | +8 |
These increases occurred across three separate policy areas, illustrating how measured AI visibility can shift simultaneously within multiple profiles.
Economy, Jobs & Growth
The Economy, Jobs & Growth domain average increased from 8.7 to 9.5, its second-highest average of the study after Week 7.
The Green Party’s profile increased from 10 to 21, recording the highest measured score within the domain for Week 9.
Meanwhile, National decreased from 14 to 10 and Labour from 14 to 11.
Te Pāti Māori increased slightly from 6 to 7, while NZ First and ACT remained unchanged at 2 and 6 respectively.
The overall increase in this domain was therefore primarily associated with a substantial change in one profile, partly offset by decreases elsewhere.
Health
Health recorded a different pattern.
The domain average declined slightly from 19.0 to 18.7, despite the Green Party’s Health visibility increasing from 22 to 30.
National decreased from 24 to 21 and Labour from 29 to 26.
NZ First declined from 11 to 9, Te Pāti Māori from 12 to 10, while ACT remained unchanged at 16.
The Health domain therefore recorded a small overall decline even though one individual profile increased materially.
Health remains the highest-visibility policy domain in Week 9, and its 18.7 average is the second-highest Health result recorded during the nine-week study.
Together, the Economy and Health results demonstrate an important characteristic of the longitudinal data:
An increase in visibility for an individual party-policy profile does not necessarily result in an equivalent increase in visibility across the entire policy domain.
Insight 4: Cost of Living Reached Its Lowest Domain Average of the Study
Cost of Living recorded a decline in Week 9.
Its average fell from 16.7 in Week 8 to 15.3 in Week 9.
This is the lowest average recorded for Cost of Living during the nine weeks of monitoring.
The result is notable because Cost of Living has consistently been one of the more visible policy domains in the study.
Its highest average was 21.3 in Week 4.
The Week 9 changes again reveal considerable variation between individual profiles.
| Party | Week 8 | Week 9 | Change |
|---|---|---|---|
| National | 30 | 33 | +3 |
| Labour | 23 | 26 | +3 |
| Green | 17 | 15 | -2 |
| NZ First | 10 | 9 | -1 |
| Te Pāti Māori | 9 | 6 | -3 |
| ACT | 11 | 3 | -8 |
| Domain average | 16.7 | 15.3 | -1.3 |
National increased from 30 to 33, recording the highest individual AI Visibility Score across all 30 monitored profiles in Week 9.
Labour also increased, from 23 to 26.
However, the remaining four profiles declined.
The largest decrease occurred in ACT’s Cost of Living profile, which moved from 11 to 3.
Te Pāti Māori declined from 9 to 6, Green from 17 to 15 and NZ First from 10 to 9.
The combined decreases outweighed the increases recorded by National and Labour.
As a result, the overall Cost of Living domain average declined even though its two highest-scoring profiles both increased.
This provides another example of why aggregate figures should be interpreted alongside the underlying party-policy data.
The change also highlights the importance of longitudinal monitoring. A policy domain that recorded relatively high visibility earlier in the study may not sustain that position as the AI information environment evolves.
Insight 5: Housing Remained Almost Invisible — With No Week-on-Week Movement
Housing remained the lowest-visibility policy domain in Week 9.
Its average was unchanged at approximately 0.2/100.
Five of the six monitored Housing profiles recorded zero.
NZ First was the only profile with a non-zero score, remaining at 1.
| Party | Week 8 | Week 9 | Change |
|---|---|---|---|
| National | 0 | 0 | 0 |
| Labour | 0 | 0 | 0 |
| Green | 0 | 0 | 0 |
| NZ First | 1 | 1 | 0 |
| Te Pāti Māori | 0 | 0 | 0 |
| ACT | 0 | 0 | 0 |
| Domain average | 0.2 | 0.2 | 0.0 |
Unlike the other four policy domains, Housing recorded no change in any of its six monitored profiles.
This is particularly notable because Housing has consistently produced the lowest measured visibility across the nine weeks of research.
Its scores have remained close to zero despite changes in the overall AI information environment.
The result does not establish that Housing policy information is absent from the internet or that the monitored parties have failed to publish policies.
Rather, it shows that the monitored party-policy profiles are receiving very limited visibility within the defined CiteCompass generative AI research framework.
The continuing lack of measured visibility raises an important research question:
Why does Housing continue to record such limited party-policy visibility in AI-generated responses when other monitored policy areas experience substantial changes?
The longitudinal study documents this pattern but does not, from visibility scores alone, establish its cause.
Policy-Domain Visibility Shifted Again
Week 9 produced movement in four of the five monitored policy domains.
| Policy domain | Week 8 | Week 9 | Change |
|---|---|---|---|
| Health | 19.0 | 18.7 | -0.3 |
| Cost of Living | 16.7 | 15.3 | -1.3 |
| Economy, Jobs & Growth | 8.7 | 9.5 | +0.8 |
| Crime & Public Safety | 5.5 | 8.0 | +2.5 |
| Housing | 0.2 | 0.2 | 0.0 |
Crime & Public Safety recorded the largest increase in average visibility, rising by 2.5 points.
Economy, Jobs & Growth also increased and remained close to its previous Week 7 high.
Health declined slightly but retained the highest domain average.
Cost of Living declined to its lowest average since the research commenced.
Housing remained unchanged at an extremely low level.
Taken together, these movements produced a modest increase in overall measured visibility.
The changes reinforce the importance of looking beyond the combined average to understand how AI-generated information differs across policy areas.
Nine-Week Average AI Visibility Trend
| Reporting week | Average AI Visibility Score |
|---|---|
| Week 1 | 9.9 |
| Week 2 | 9.5 |
| Week 3 | 10.2 |
| Week 4 | 11.1 |
| Week 5 | 10.4 |
| Week 6 | 10.4 |
| Week 7 | 10.0 |
| Week 8 | 10.0 |
| Week 9 | 10.3 |
Week 4 remains the highest overall measured average of the study at 11.1.
Five weeks later, the average is 10.3, compared with the original Week 1 baseline of 9.9.
The difference is relatively small.
Yet the underlying data has changed substantially during that period.
Some profiles now record higher visibility, others lower visibility, while different policy domains continue to move independently.
The nine-week trend does not demonstrate a sustained upward trajectory in overall AI visibility.
Instead, the data continues to show a relatively narrow range of overall average scores, alongside considerably greater movement within individual party-policy profiles.
This remains one of the central observations of the CiteCompass longitudinal research.
What Week 9 Shows
Nine weeks of observation continue to reveal a distinction between the overall level of AI visibility and the distribution of that visibility across monitored political-policy information.
The average AI Visibility Score increased from 10.0 to 10.3.
However, 21 of the 30 monitored profiles changed, generating 88 points of absolute movement.
Crime & Public Safety recorded the largest domain-level increase.
Economy, Jobs & Growth also increased, with a significant change in the Green Party’s monitored profile.
Health retained the highest average across the five policy domains, despite declining slightly.
Cost of Living fell to its lowest measured average of the study.
Housing remained close to zero, with no week-on-week change in any monitored profile.
And 24 of the 30 profiles — 80% — still record AI Visibility Scores below 20/100.
The central Week 9 finding can therefore be summarised as:
Political-party AI visibility remains persistently low overall, while the information surfaced by generative AI continues to redistribute substantially between parties and policy domains.
The research is not establishing which political information is more correct, valuable or persuasive.
It is documenting how that information is represented and surfaced within generative AI systems as the election information environment evolves.
What the Data Does — and Does Not — Tell Us
AI Visibility Scores measure the observable presence of monitored political-policy information within the defined CiteCompass generative AI research framework.
The scores provide comparative, directional evidence of measured AI visibility across the 30 monitored profiles.
They do not represent the percentage of New Zealand voters exposed to particular policy information.
They also do not measure:
- The quality, effectiveness or desirability of political policies.
- Electoral support, voting intention or voter preference.
- The accuracy of every AI-generated response.
- Actual voter behaviour or real-world voter sentiment.
- The impact of AI visibility on voting decisions or election outcomes.
The findings should also be understood within the limitations of a longitudinal observational study.
CiteCompass uses an equivalent research architecture, policy-domain framework, persona methodology, AI-platform framework and measurement approach across the six monitored parties.
Individual research queries are dynamically generated to model changing information needs within an evolving information environment.
Generative AI outputs can also vary between runs.
Changes in scores therefore describe observed visibility differences within the research framework. They should not be interpreted as demonstrating that a particular policy announcement, source or political event directly caused a measured change.
Research Methodology and Political Independence
CiteCompass is conducting a 12-week independent longitudinal observational study examining how leading generative AI platforms represent publicly available political-policy information.
The study monitors six political parties across five policy domains, creating 30 party-policy research profiles.
All six parties are monitored using an equivalent methodology and reporting framework.
CiteCompass is politically independent.
This research does not assess which political party has the best policies, recommend how New Zealanders should vote, predict election results or measure electoral support.
Its purpose is to understand how publicly available political information is represented, surfaced, cited and sourced within generative AI systems.
The research is governed by a simple principle:
Observe. Measure. Report. Do not advocate.
For further information, visit:
Read the CiteCompass NZ Election 2026 Research Methodology
Visit the Interactive Data Report here
Research disclosure: The CiteCompass NZ Election 2026 AI Visibility Monitor is an independent observational research initiative. The results represent measured AI visibility within the defined research framework and do not constitute political endorsements, assessments of policy quality, measures of voter support or predictions of election outcomes.