

Overall Visibility Rises as Cost of Living Broadens and Policy-Level Volatility Continues
Week 4 of the CiteCompass NZ Election 2026 AI Visibility Monitor recorded a further increase in overall measured political-party visibility, alongside substantial movement within individual policy areas.
Across all 30 party-policy combinations, the average AI Visibility Score increased from 10.2 in Week 3 to 11.1 in Week 4.
The distribution of visibility also changed materially. Labour recorded 35%in Cost of Living and 38% in Health. National recorded 17% in Crime & Public Safety and 13% in Economy, Jobs & Growth. Housing remained the lowest-visibility policy domain, although National and NZ First each recorded 4%.
The Week 4 results reinforce an observation emerging across the first month of the study:
Overall political-party AI visibility is increasing gradually, but movement within individual party-policy profiles remains highly variable from week to week.
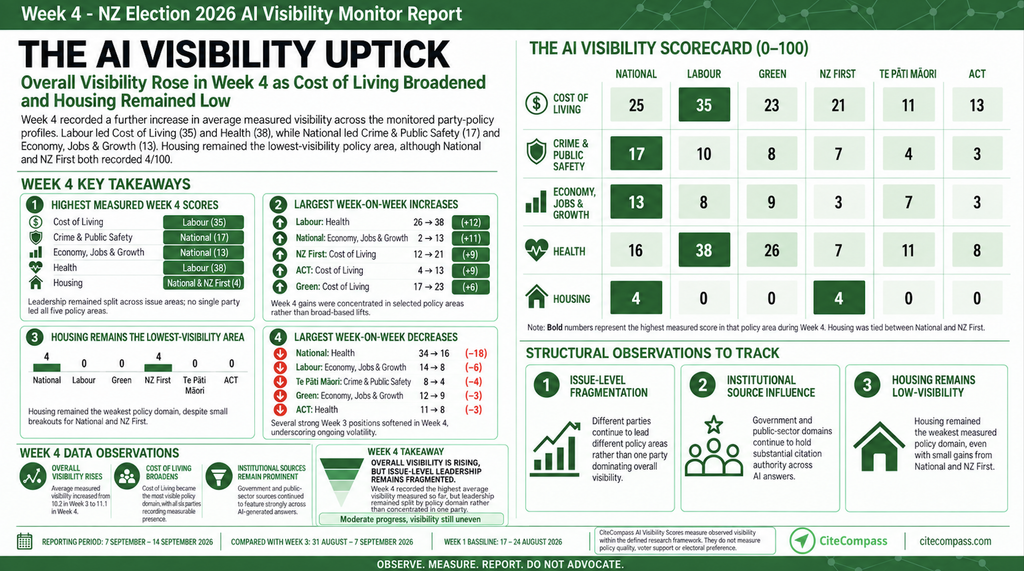
[INSERT WEEK 4 INFOGRAPHIC — FULL WIDTH]
Week 4 — NZ Election 2026 AI Visibility Monitor. Reporting period: 7–14 September 2026 UTC. AI Visibility Scores are CiteCompass research metrics measured on a 0–100 scale within the defined research framework.
Summary of Week 4 Findings
Across the six parliamentary parties and five policy areas monitored:
- 30 party-policy combinations were measured.
- 24 of 30 recorded AI Visibility Scores below 20%.
- 4 combinations recorded a visibility score of 0%, all within Housing.
- 38%was the highest individual Week 4 score, recorded by Labour in Health.
- Overall average measured visibility increased from 10.2 to 11.1.
- Cost of Living recorded the highest policy-domain average at 21.3%.
- National’s Economy, Jobs & Growth visibility changed from 2 to 13 (+11).
- Labour’s Health visibility changed from 26 to 38 (+12).
- NZ First and ACT each recorded a +9 change in Cost of Living.
- Housing remained the lowest-visibility domain, averaging 1.3%.
The Week 4 average is now above the Week 1 baseline of 9.9, although the four-week sequence — 9.9, 9.5, 10.2 and 11.1 — demonstrates that movement has not been uniformly upward.
The Week 4 Visibility Scorecard
The following table displays the comparative AI Visibility Scores (0–100) across the six parliamentary parties and five monitored policy domains.
| Policy Area | National | Labour | Green | NZ First | Te Pāti Māori | ACT |
|---|---|---|---|---|---|---|
| Cost of Living | 25 | 35 | 23 | 21 | 11 | 13 |
| Crime & Public Safety | 17 | 10 | 8 | 7 | 4 | 3 |
| Economy, Jobs & Growth | 13 | 8 | 9 | 3 | 7 | 3 |
| Health | 16 | 38 | 26 | 7 | 11 | 8 |
| Housing | 4 | 0 | 0 | 4 | 0 | 0 |
These scores measure visibility within the defined CiteCompass research framework. They do not measure policy quality, political effectiveness, electoral support or voter preference. The published methodology specifically limits interpretation to observable AI behaviour, source visibility and change over time. (CiteCompass)
Insight 1: Overall Visibility Increases, but Remains Relatively Low
Average visibility across the full set of 30 party-policy profiles increased from 10.2 in Week 3 to 11.1 in Week 4.
That is the highest overall average recorded during the first four reporting periods:
Week 1 — 9.9
Week 2 — 9.5
Week 3 — 10.2
Week 4 — 11.1
However, 24 of the 30 individual profiles still recorded scores below 20%.
The emerging picture is therefore not one of uniformly high political-party visibility. Rather, individual pockets of greater visibility are appearing within an information environment where most measured party-policy profiles continue to record relatively low scores.
Insight 2: Cost of Living Becomes the Most Visible Policy Domain
Cost of Living recorded the clearest domain-level increase in Week 4.
The average score increased from 17.2 in Week 3 to 21.3 in Week 4.
Week 4 scores were:
Labour 35 | National 25 | Green 23 | NZ First 21 | ACT 13 | Te Pāti Māori 11
The week-on-week movements were:
National 24 → 25 (+1)
Labour 36 → 35 (-1)
Green 17 → 23 (+6)
NZ First 12 → 21 (+9)
Te Pāti Māori 10 → 11 (+1)
ACT 4 → 13 (+9)
Five of the six parties recorded either stable or increased visibility, with the most substantial changes recorded by NZ First and ACT.
This broadening of measurable presence is different from Week 3, when Cost of Living visibility was more concentrated.
It will be important to observe whether this broader distribution persists in subsequent weeks.
Insight 3: Economy, Jobs & Growth Records Another Significant Redistribution
Economy, Jobs & Growth continued to demonstrate substantial week-to-week movement.
Week 4 scores were:
National 13 | Green 9 | Labour 8 | Te Pāti Māori 7 | NZ First 3 | ACT 3.
The corresponding changes from Week 3 were:
National 2 → 13 (+11)
Labour 14 → 8 (-6)
Green 12 → 9 (-3)
NZ First 3 → 3 (no change)
Te Pāti Māori 7 → 7 (no change)
ACT 1 → 3 (+2).
The domain average increased from 6.5 to 7.2.
National’s 11-point increase is one of the largest individual movements recorded during Week 4, while Labour moved six points in the opposite direction.
The observational data identifies the change but does not establish its cause. Under the study methodology, movements may reflect changes in online information, sources, media coverage, AI systems, generated research queries or other elements within the evolving information environment. (CiteCompass)
Insight 4: Health Shows the Largest Two-Way Movement
Health produced the most pronounced redistribution between individual profiles in Week 4.
The measured scores were:
Labour 38 | Green 26 | National 16 | Te Pāti Māori 11 | ACT 8 | NZ First 7.
Compared with Week 3:
Labour 26 → 38 (+12)
National 34 → 16 (-18)
Green 22 → 26 (+4)
NZ First 7 → 7 (no change)
Te Pāti Māori 8 → 11 (+3)
ACT 11 → 8 (-3).
Despite these substantial individual movements, the policy-domain average changed only slightly, from 18.0 in Week 3 to 17.7 in Week 4.
This is an important example of why the study examines both individual profiles and the overall policy information environment.
Large changes between parties do not necessarily mean that total visibility within the policy domain has changed by the same amount.
There is also insufficient evidence within the observational data to attribute these changes to tone, partisanship, content structure or any other single factor.
Insight 5: Crime & Public Safety Contracts Slightly After Week 3
Crime & Public Safety recorded a lower policy-domain average in Week 4, moving from 9.3 to 8.2.
The Week 4 scores were:
National 17 | Labour 10 | Green 8 | NZ First 7 | Te Pāti Māori 4 | ACT 3
Week-on-week movements were comparatively modest for most profiles:
National +1 | Labour 0 | Green -2 | NZ First -1 | Te Pāti Māori -4 | ACT -1.
All six party-policy profiles remained below 20%.
Compared with Cost of Living, the Crime & Public Safety information environment therefore continued to record substantially lower political-party visibility during Week 4.
Insight 6: Housing Shows New Measurable Presence, but Remains Very Low
Housing remains the lowest-visibility policy domain in the study.
Week 4 scores were:
National 4 | NZ First 4 | Labour 0 | Green 0 | Te Pāti Māori 0 | ACT 0.
National changed from 1 to 4 (+3), while NZ First changed from 0 to 4 (+4).
The remaining four profiles remained at zero.
As a result, the average Housing visibility score increased from 0.2 in Week 3 to 1.3 in Week 4.
This represents greater measurable presence than Week 3, but the absolute level remains very low relative to the other four policy areas.
Housing therefore continues to provide one of the clearest examples of the difference between an issue having significant public importance and political-party information necessarily being visible within AI-generated research answers.
Week 4 Visibility by Policy Area
Looking across all six parties, the policy-domain averages changed as follows:
| Policy Area | Week 3 | Week 4 | Change |
|---|---|---|---|
| Cost of Living | 17.2 | 21.3 | +4.2 |
| Health | 18.0 | 17.7 | -0.3 |
| Crime & Public Safety | 9.3 | 8.2 | -1.2 |
| Economy, Jobs & Growth | 6.5 | 7.2 | +0.7 |
| Housing | 0.2 | 1.3 | +1.2 |
The most significant domain-level change was therefore in Cost of Living, rather than Health or Economy.
This is another useful reminder that individual party movements and overall policy-domain movement are different measures.
Four Weeks In: The Longitudinal Picture Is Becoming Clearer
Four reporting periods are still too few to establish durable long-term trends, but several recurring characteristics are now observable.
1. AI Visibility Is Variable
Individual party-policy profiles continue to move materially from week to week.
Week 4 provides several examples: Labour Health +12, National Economy +11, NZ First Cost of Living +9, ACT Cost of Living +9, and National Health -18.
2. Policy Domain Matters
The difference between policy areas remains substantial.
Cost of Living averaged 21.3, compared with only 1.3 for Housing in Week 4.
This reinforces an observation from previous weeks: AI visibility cannot be understood solely at party level. The information environment surrounding the subject being researched also appears materially different from one policy domain to another.
3. Higher Visibility Is Not Consistently Concentrated in One Party
Week 4 again shows different measured patterns across different policy areas.
Rather than a single organisation recording uniformly high visibility across all five domains, the results remain distributed and issue-specific.
What Week 4 Tells Us and What It Does Not
Week 4 adds another observation to the longitudinal record, but AI visibility should not be interpreted as a measure of political performance.
The study does not establish that:
- a higher visibility score represents a better policy;
- a lower score represents a weaker policy;
- greater AI visibility translates into electoral support;
- changes in visibility represent changes in voter intention;
- one party is politically stronger because it records a higher result;
- a particular content strategy caused an observed increase or decrease; or
- the current scores will persist in subsequent reporting periods.
CiteCompass measures how publicly available political information is represented, surfaced, cited and sourced within generative AI systems. The published methodology explicitly distinguishes these observations from political-policy evaluation, polling and voter sentiment. (CiteCompass)
Why We Do Not Attribute Causes to Weekly Changes
The NZ Election 2026 AI Visibility Monitor is intentionally designed as a longitudinal observational study, rather than a controlled experiment.
During the research period, political parties may publish new information, media coverage changes, AI systems evolve, third-party sources change and the information needs represented by dynamically generated queries can also change. CiteCompass therefore reports what was measured, observed, surfaced, cited, increased, decreased or changed, without converting those observations into claims about political merit or unsupported explanations for why an individual result moved. (CiteCompass)
That distinction becomes increasingly important as week-to-week volatility becomes visible in the data.
Our Governing Research Principle
The study does not assess the merits of political policies, recommend how New Zealanders should vote, predict election outcomes or measure voter sentiment.
Observe. Measure. Report. Do not advocate.
CiteCompass states that it has consulted the New Zealand Electoral Commission regarding the structure and publication of the research initiative and is conducting the study in accordance with the guidance received. (CiteCompass)
About the NZ Election 2026 AI Visibility Monitor
The CiteCompass NZ Election 2026 AI Visibility Monitor is an independent 12-week longitudinal observational study examining how leading generative AI platforms surface, represent and cite publicly available political-policy information during the lead-up to the 2026 New Zealand General Election.
The study monitors six parliamentary political parties across five policy domains:
- Cost of Living
- Economy, Jobs and Growth
- Health
- Housing
- Crime and Public Safety
All six parties are monitored using an equivalent research architecture, profile framework, dynamic-query methodology, AI-platform framework, monitoring cadence, measurement framework, data-retention process, QA process and reporting methodology. (CiteCompass)
The study is observational rather than a controlled experiment.
Political Independence
CiteCompass is politically independent.
The research does not assess which political party has the best policies, recommend how New Zealanders should vote, predict election results, rank politicians, constitute political polling or claim that AI visibility determines voting behaviour. (CiteCompass)
CiteCompass also states that it will not provide AI-visibility optimisation services to any monitored political party or candidate for the duration of the research programme, separating the measurement of political AI visibility from commercial activity intended to improve it. (CiteCompass)
Explore the Research
NZ Election 2026 AI Visibility Monitor & Methodology
The project workbook confirms these as the current published research URLs.
Research Information
Week 4 reporting period: 7–14 September 2026 UTC
Study duration: 12 weeks
Methodology version: 1.0
Research and Media Enquiries
Journalists, researchers, political parties and other interested parties may contact CiteCompass regarding the research framework, methodology, published findings or objective factual corrections.
CiteCompass
[email protected]