

Five Weeks On: The AI Visibility Gap Has Changed Shape
Five weeks after establishing the baseline for the CiteCompass NZ Election 2026 AI Visibility Monitor, the overall level of measured political-party AI visibility has changed only modestly.
The average AI Visibility Score across the 30 monitored party-policy profiles increased from 9.9 in Week 1 to 10.4 in Week 5.
That 0.5-point change, however, conceals considerably greater movement beneath the overall average.
Across the 30 individual profiles, 11 recorded a higher score than at the Week 1 baseline, 13 recorded a lower score and six were unchanged.
The composition of visibility has also changed differently by policy area.
Crime & Public Safety recorded a substantial increase in average visibility. Economy, Jobs & Growth recorded a decrease. Cost of Living and Health remained comparatively close to their original domain averages, despite material movement within individual party-policy profiles.
Perhaps most notably, the difference between the highest and lowest measured scores narrowed across four of the five policy domains.
The Week 5 picture is therefore not simply one of AI visibility increasing or decreasing.
It is one of redistribution.
Political-party information is appearing differently across the monitored policy areas than it did at the baseline, even though the overall level of measured visibility remains relatively low.
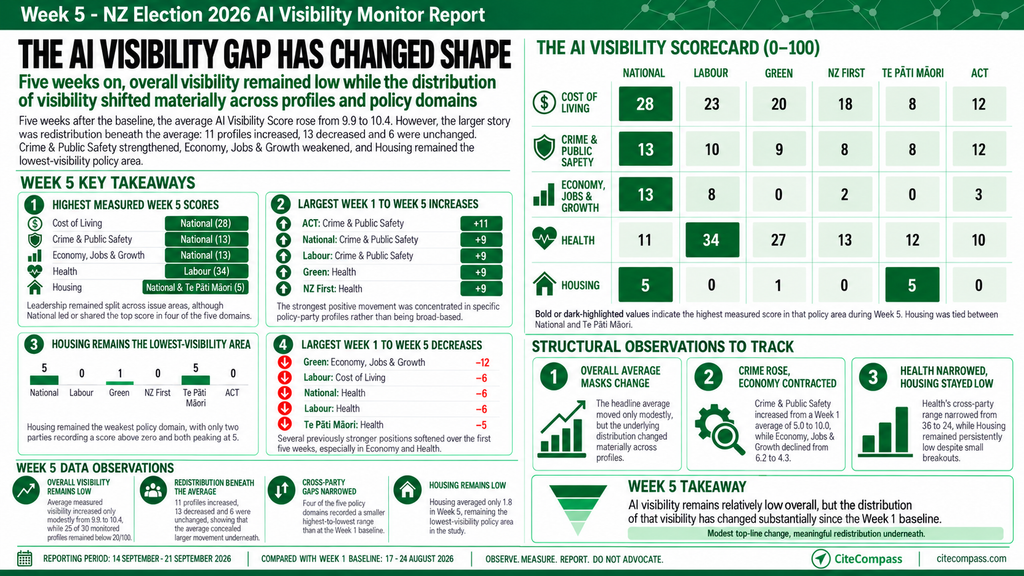
Week 5 reporting period: 14–21 September 2026 UTC. AI Visibility Scores are CiteCompass research metrics measured on a 0–100 scale within the defined research framework.
Week 1 to Week 5: The Overall Picture
The baseline established a relatively low level of political-party visibility within the AI research environment.
In Week 1, the average score across the 30 monitored party-policy profiles was 9.9. Twenty-seven of the 30 profiles recorded scores below 20, while six recorded zero visibility. Those figures formed the baseline against which subsequent weekly observations are compared. (CiteCompass)
By Week 5, the overall average had increased to 10.4.
| Measure | Week 1 | Week 5 | Change |
|---|---|---|---|
| Average AI Visibility Score | 9.9 | 10.4 | +0.5 |
| Profiles below 20/100 | 27 / 30 | 25 / 30 | -2 profiles |
| Profiles recording zero | 6 | 5 | -1 profile |
| Profiles at 20 or above | 3 | 5 | +2 profiles |
The broad visibility deficit identified at the baseline has therefore narrowed slightly, but it has not disappeared.
Twenty-five of the 30 monitored profiles — 83% — still recorded an AI Visibility Score below 20 in Week 5.
The larger changes become apparent when the 30 profiles are examined individually.
Full Week 1 to Week 5 AI Visibility Gap Analysis
The following table compares every monitored party-policy profile between the Week 1 baseline and Week 5.
The change shown is the difference in AI Visibility Score between the two measurement periods.
| Policy domain | National | Labour | Green | NZ First | Te Pāti Māori | ACT |
|---|---|---|---|---|---|---|
| Cost of Living | 32 → 28 (-4) | 29 → 23 (-6) | 17 → 20 (+3) | 19 → 18 (-1) | 12 → 8 (-4) | 5 → 12 (+7) |
| Crime & Public Safety | 4 → 13 (+9) | 1 → 10 (+9) | 13 → 9 (-4) | 3 → 8 (+5) | 8 → 8 (0) | 1 → 12 (+11) |
| Economy, Jobs & Growth | 16 → 13 (-3) | 0 → 8 (+8) | 12 → 0 (-12) | 6 → 2 (-4) | 0 → 0 (0) | 3 → 3 (0) |
| Health | 17 → 11 (-6) | 40 → 34 (-6) | 18 → 27 (+9) | 4 → 13 (+9) | 17 → 12 (-5) | 14 → 10 (-4) |
| Housing | 1 → 5 (+4) | 0 → 0 (0) | 5 → 1 (-4) | 0 → 0 (0) | 0 → 5 (+5) | 0 → 0 (0) |
The table demonstrates why the overall average does not tell the full story.
The average across all 30 profiles moved by only +0.5 points, while individual party-policy profiles moved by considerably larger amounts in both directions.
This is the principal difference between the Week 1 baseline and Week 5: aggregate visibility has remained relatively stable while the distribution underneath it has changed substantially.
Crime & Public Safety: The Clearest Domain-Level Change
Crime & Public Safety shows the largest change at policy-domain level between the Week 1 baseline and Week 5.
Its average AI Visibility Score increased from 5.0 to 10.0.
| Crime & Public Safety | Week 1 | Week 5 | Change |
|---|---|---|---|
| National | 4 | 13 | +9 |
| Labour | 1 | 10 | +9 |
| Green | 13 | 9 | -4 |
| NZ First | 3 | 8 | +5 |
| Te Pāti Māori | 8 | 8 | 0 |
| ACT | 1 | 12 | +11 |
| Domain average | 5.0 | 10.0 | +5.0 |
The change is also visible in the distribution of scores.
At the baseline, the highest Crime & Public Safety score was 13 and the lowest was 1 — a 12-point range.
By Week 5, the six scores sit between 8 and 13, reducing the range to five points.
The result is therefore not simply a higher domain average. Measurable visibility has also become more evenly distributed across the six monitored profiles.
Cost of Living: Similar Overall Visibility, Different Distribution
Cost of Living began the study with the highest policy-domain average at 19.0. (CiteCompass)
By Week 5 the domain average was 18.2, a change of less than one point.
The individual profiles, however, did not remain static.
| Cost of Living | Week 1 | Week 5 | Change |
|---|---|---|---|
| National | 32 | 28 | -4 |
| Labour | 29 | 23 | -6 |
| Green | 17 | 20 | +3 |
| NZ First | 19 | 18 | -1 |
| Te Pāti Māori | 12 | 8 | -4 |
| ACT | 5 | 12 | +7 |
| Domain average | 19.0 | 18.2 | -0.8 |
At Week 1, the difference between the highest and lowest measured Cost of Living scores was 27 points.
By Week 5 that range had narrowed to 20 points.
The overall level of visibility is therefore relatively similar to the baseline, while the distribution of that visibility across the monitored profiles has changed.
This distinction becomes increasingly important as the study develops: a stable domain average does not necessarily mean that the underlying information environment is stable.
Economy, Jobs & Growth: Overall Visibility Has Contracted
Economy, Jobs & Growth moved in the opposite direction.
The domain average decreased from 6.2 in Week 1 to 4.3 in Week 5.
| Economy, Jobs & Growth | Week 1 | Week 5 | Change |
|---|---|---|---|
| National | 16 | 13 | -3 |
| Labour | 0 | 8 | +8 |
| Green | 12 | 0 | -12 |
| NZ First | 6 | 2 | -4 |
| Te Pāti Māori | 0 | 0 | 0 |
| ACT | 3 | 3 | 0 |
| Domain average | 6.2 | 4.3 | -1.8 |
The domain illustrates how redistribution can occur in both directions simultaneously.
One monitored profile changed from zero to measurable visibility, while another moved from measurable visibility to zero.
Meanwhile, the domain as a whole became less visible.
The cross-party score range decreased from 16 points at the baseline to 13 points in Week 5.
Health: Almost Unchanged Overall, but Substantially Different Underneath
Health provides one of the clearest examples of why longitudinal analysis should look beyond averages.
The Week 1 Health average was 18.3.
In Week 5 it was 17.8.
On the surface, the domain has changed very little.
The individual profile movements show a different picture.
| Health | Week 1 | Week 5 | Change |
|---|---|---|---|
| National | 17 | 11 | -6 |
| Labour | 40 | 34 | -6 |
| Green | 18 | 27 | +9 |
| NZ First | 4 | 13 | +9 |
| Te Pāti Māori | 17 | 12 | -5 |
| ACT | 14 | 10 | -4 |
| Domain average | 18.3 | 17.8 | -0.5 |
The difference between the highest and lowest Health scores has also narrowed.
In Week 1, Health ranged from 4 to 40, a 36-point spread.
By Week 5, the range was 10 to 34, a 24-point spread.
That represents a 12-point reduction in the cross-party range, the largest reduction among the five monitored policy domains.
The important observation is statistical rather than political: overall Health visibility is close to its baseline level, but the distribution of that visibility across the monitored profiles is materially different.
Housing: The Persistent Low-Visibility Domain
Housing remains qualitatively different from the other four policy areas.
Its domain average increased from 1.0 in Week 1 to 1.8 in Week 5, but measured visibility remains very low.
| Housing | Week 1 | Week 5 | Change |
|---|---|---|---|
| National | 1 | 5 | +4 |
| Labour | 0 | 0 | 0 |
| Green | 5 | 1 | -4 |
| NZ First | 0 | 0 | 0 |
| Te Pāti Māori | 0 | 5 | +5 |
| ACT | 0 | 0 | 0 |
| Domain average | 1.0 | 1.8 | +0.8 |
Three of the six Housing profiles still recorded zero visibility in Week 5.
The highest measured score also remains only 5.
Housing therefore continues to represent a persistent low-visibility area within the study, although the individual profiles contributing to the measurable visibility have changed since the baseline.
The Cross-Party Visibility Gap Has Narrowed in Four of Five Policy Areas
A useful way to examine the five-week change is to measure the range within each policy domain.
For this analysis, the range is simply the difference between the highest and lowest AI Visibility Score recorded across the six monitored party profiles.
| Policy domain | Week 1 average | Week 5 average | Average change | Week 1 range | Week 5 range | Change in range |
|---|---|---|---|---|---|---|
| Cost of Living | 19.0 | 18.2 | -0.8 | 27 | 20 | -7 |
| Crime & Public Safety | 5.0 | 10.0 | +5.0 | 12 | 5 | -7 |
| Economy, Jobs & Growth | 6.2 | 4.3 | -1.8 | 16 | 13 | -3 |
| Health | 18.3 | 17.8 | -0.5 | 36 | 24 | -12 |
| Housing | 1.0 | 1.8 | +0.8 | 5 | 5 | 0 |
This reveals one of the more significant changes between Week 1 and Week 5.
Four of the five policy domains now have a smaller gap between their highest and lowest measured party-policy scores than they did at the baseline.
Health’s range reduced by 12 points.
Cost of Living and Crime & Public Safety each reduced by seven points.
Economy, Jobs & Growth reduced by three points.
Housing remained unchanged.
This does not indicate that political policies themselves are converging, nor does it measure political support.
It means only that the measured AI Visibility Scores within those policy domains are less dispersed than they were at the Week 1 baseline.
Most Profiles Remain Below 20
The number of profiles recording an AI Visibility Score of 20 or above has increased from three at the Week 1 baseline to five in Week 5.
Correspondingly, the number below 20 has reduced from 27 to 25.
That represents some broadening of measurable visibility, but it remains a relatively small change across the 30-profile research set.
More than four out of five monitored party-policy profiles remain below 20/100 in Week 5.
The broad visibility deficit identified in Week 1 therefore remains evident five weeks into the study.
Zero Visibility Has Shifted Rather Than Disappeared
The number of zero-score profiles decreased from six in Week 1 to five in Week 5.
The composition of those zero scores also changed.
Some profiles that recorded no measurable visibility at the baseline subsequently recorded measurable visibility, while another profile that recorded measurable visibility in Week 1 recorded zero in Week 5.
Several Housing profiles recorded zero at both measurement points.
The five-week data therefore provides an important caution against treating an individual zero score as a permanent characteristic of a party-policy profile.
Visibility within the measured generative AI environment can change in both directions over time.
What Has Changed After Five Weeks?
Five weeks of measurements are beginning to reveal a more nuanced picture than the Week 1 baseline alone could provide.
- Overall political-party AI visibility remains relatively low. The average has moved from 9.9 to 10.4, while 25 of the 30 monitored profiles remain below 20.
- The overall average masks considerably larger movement underneath it. Eleven individual profiles are above their Week 1 score, 13 are below it and six are unchanged.
- Crime & Public Safety has changed substantially at domain level. Its average increased from 5.0 to 10.0 and its cross-party range narrowed from 12 points to five.
- Cost of Living and Health remain relatively close to their baseline averages, but their internal distributions have changed. The change is particularly visible in Health, where the cross-party score range narrowed from 36 points to 24.
- Economy, Jobs & Growth has become less visible overall. Its average decreased from 6.2 to 4.3.
- Housing remains the persistent low-visibility policy area. Its average increased only from 1.0 to 1.8, with three monitored profiles still recording zero visibility.
Taken together, the data suggests that the most important Week 1-to-Week 5 change is not a large increase in overall visibility.
It is a change in where that visibility is distributed.
Five Weeks In: What the Data Does and Does Not Tell Us
Five weekly observations provide a stronger longitudinal dataset than the original baseline, but they should not be interpreted as evidence of political performance.
AI Visibility Scores measure observable information presence within the defined CiteCompass research framework.
They do not measure policy quality, political effectiveness, electoral support or voter preference. The published study also distinguishes changes in visibility from claims about why those changes occurred. (CiteCompass)
The research environment is dynamic.
Political parties may publish or change information. Media coverage changes. Government and institutional information changes. Third-party sources change. Generative AI platforms and models can change. CiteCompass’s dynamically generated research queries also evolve within the consistently applied research framework.
For those reasons, this analysis reports what changed between Week 1 and Week 5 without attributing individual changes to a particular political announcement, campaign action, content strategy, media event or technical change.
The study is longitudinal and observational rather than a controlled experiment. (CiteCompass)
The Week 5 Finding
Five weeks after the baseline, the principal finding is not that political-party AI visibility has increased dramatically.
It has not.
The overall average moved from 9.9 to 10.4.
The more substantial changes are occurring within the distribution.
Crime & Public Safety has become more visible across the monitored profiles.
Economy, Jobs & Growth has become less visible overall.
Cost of Living and Health remain close to their original domain averages while containing substantial movement within individual profiles.
Housing remains persistently low.
At the same time, the difference between the highest and lowest measured scores has narrowed across four of the five policy domains.
The emerging five-week picture can therefore be summarised as:
AI visibility remains relatively low overall, but the distribution of that visibility has changed substantially since the Week 1 baseline, with narrower cross-party gaps across most monitored policy domains.
Our Governing Research Principle
The CiteCompass NZ Election 2026 AI Visibility Monitor does not assess the merits of political policies, recommend how New Zealanders should vote, predict election outcomes or measure voter sentiment.
Observe. Measure. Report. Do not advocate.
CiteCompass has stated in its published reports that it consulted the New Zealand Electoral Commission regarding the structure and publication of the research initiative and is conducting the study in accordance with the guidance received. (CiteCompass)
About the NZ Election 2026 AI Visibility Monitor
The CiteCompass NZ Election 2026 AI Visibility Monitor is an independent 12-week longitudinal observational study examining how leading generative AI platforms surface, represent and cite publicly available political-policy information during the lead-up to the 2026 New Zealand General Election.
The study monitors six parliamentary political parties across five policy domains: Cost of Living; Economy, Jobs and Growth; Health; Housing; and Crime and Public Safety.
All parties are monitored using an equivalent research architecture, profile framework, dynamic-query methodology, AI-platform framework, monitoring cadence, measurement framework, data-retention process, QA process and reporting methodology.
Individual research queries may change over time as part of CiteCompass’s dynamic methodology designed to model changing information needs and the evolving election information environment.
The study is observational rather than a controlled experiment.
Political Independence
CiteCompass is politically independent.
The research does not assess which political party has the best policies, endorse or oppose a political party or candidate, recommend how New Zealanders should vote, predict election results, constitute political polling, measure voter sentiment or claim that AI visibility determines voter behaviour.
CiteCompass reports measured changes in how publicly available political information is represented, surfaced, sourced and cited within generative AI systems. (CiteCompass)
CiteCompass has also stated that it will not provide AI-visibility optimisation services to any monitored political party or candidate for the duration of the research programme. (CiteCompass)
Research Information
Week 1 baseline: Research commenced 25 August 2026
Week 5 reporting period: 14–21 September 2026 UTC
Study duration: 12 weeks
Profiles monitored: 30 party-policy combinations
Methodology: Version 1.0
Research and Media Enquiries
Journalists, researchers, political parties and other interested parties are welcome to contact CiteCompass regarding the research framework, methodology, published findings or objective factual corrections.