

Final Pre-Election Snapshot: AI Visibility Surge
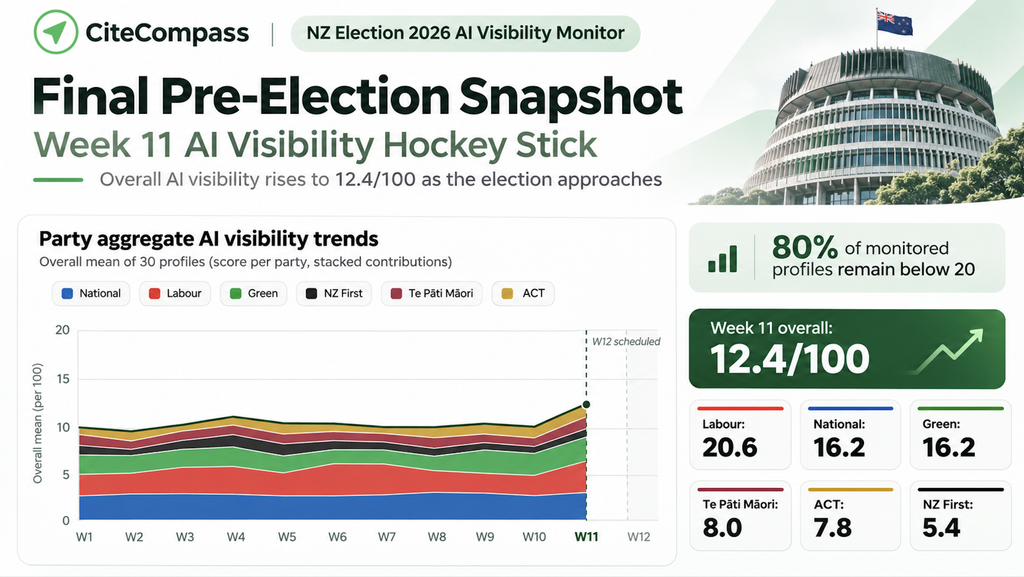
With New Zealand’s General Election scheduled for Saturday 7 November 2026, the final pre-election edition of the CiteCompass NZ Election 2026 AI Visibility Monitor records a notable change in how generative AI surfaces political-party policy information.
After all five monitored policy domains declined together in Week 10, all five increased in Week 11. This sharp late-stage upward turn is the “hockey stick” in the title: a one-week shift in the measured series, not evidence of sustained exponential growth.
The overall average AI Visibility Score across 30 monitored party-policy profiles rose from 10.0/100 to 12.4/100, the highest weekly average recorded in the first eleven weeks of the study.
Yet the increase does not remove the wider visibility gap: 24 of the 30 profiles (80%) still score below 20/100, while four record zero.
The distinction matters as the election approaches. The study documents how party-policy information is represented within defined AI-generated research activity. It does not assess the quality of political policies, measure voter preferences or predict an election outcome.
Week 11 reporting period: 26 October–2 November 2026 UTC. This is the last weekly report published before the 7 November election; the study’s twelfth reporting period will conclude after polling day.
Week 11 at a Glance
| Measure | Week 11 |
|---|---|
| Average AI Visibility Score | 12.4 / 100 |
| Week 10 average | 10.0 / 100 |
| Week 1 baseline | 9.9 / 100 |
| Change from Week 10 | +2.3 points |
| Profiles scoring below 20 | 24 / 30 (80%) |
| Profiles scoring 20 or above | 6 / 30 |
| Profiles scoring zero | 4 / 30 |
| Highest individual Week 11 score | 37 / 100 |
| Profiles increasing versus Week 10 | 17 |
| Profiles decreasing versus Week 10 | 7 |
| Profiles unchanged | 6 |
| Combined absolute movement across profiles | 114 points |
Week 11 reverses the direction of the previous reporting period: 17 individual profiles increased, seven decreased and six remained unchanged. Across the dataset, the individual changes totalled 114 points of absolute movement, compared with 61 points in Week 10.
The +2.3-point change is calculated using unrounded overall averages (12.3667 versus 10.0333). The headline scores are displayed to one decimal place as 12.4 and 10.0.
Although the aggregate score rose, the variation underneath shows why a single headline average cannot describe the entire AI information environment.
Week 11 AI Visibility Scorecard
The table below reproduces the AI Visibility Scores for all 30 monitored party-policy profiles.
| Policy domain | National | Labour | Green | NZ First | Te Pāti Māori | ACT |
|---|---|---|---|---|---|---|
| Cost of Living | 25 | 30 | 18 | 5 | 9 | 16 |
| Crime & Public Safety | 15 | 12 | 12 | 4 | 5 | 4 |
| Economy, Jobs & Growth | 11 | 21 | 16 | 3 | 8 | 1 |
| Health | 25 | 37 | 35 | 15 | 18 | 18 |
| Housing | 5 | 3 | 0 | 0 | 0 | 0 |
Bold figures identify the highest measured AI Visibility Score within each policy-domain row. They are not assessments of policy merit or electoral support. The figures are observations from CiteCompass’s defined research framework.
Insight 1: All Five Policy Domains Rebound After Week 10’s Simultaneous Decline
Week 10 marked the first point in the study at which every monitored policy domain declined during the same reporting period. Week 11 shows the opposite pattern: each of the five domain averages increased.
| Policy domain | Week 10 | Week 11 | Change |
|---|---|---|---|
| Health | 18.3 | 24.7 | +6.3 |
| Cost of Living | 15.0 | 17.2 | +2.2 |
| Economy, Jobs & Growth | 9.0 | 10.0 | +1.0 |
| Crime & Public Safety | 7.8 | 8.7 | +0.8 |
| Housing | 0.0 | 1.3 | +1.3 |
Domain averages and changes are rounded to one decimal place; changes are calculated from unrounded values.
Health recorded the largest rise, increasing by 6.3 points to 24.7/100. The Cost of Living average rose by 2.2 points, while Economy, Crime and Housing also increased.
This reversal produces the highest overall average of the eleven reporting weeks, above the previous peak of 11.1/100 in Week 4.
However, the observed change should not be attributed to a particular election event, campaign activity, policy announcement or adjustment made by an AI platform. The study is longitudinal and observational, and its research queries are dynamically generated under a consistently applied methodology.
Insight 2: Health Accounts for More Than Half of the Net Increase
Health is the clearest contributor to Week 11’s aggregate movement.
All six monitored Health profiles increased from Week 10 to Week 11:
| Party | Week 10 | Week 11 | Change |
|---|---|---|---|
| National | 18 | 25 | +7 |
| Labour | 26 | 37 | +11 |
| Green | 26 | 35 | +9 |
| NZ First | 9 | 15 | +6 |
| Te Pāti Māori | 15 | 18 | +3 |
| ACT | 16 | 18 | +2 |
Together, the six Health scores increased by 38 points. That represents approximately 54% of the 70-point net increase across all 30 profiles.
Health’s Week 11 average of 24.7/100 is its highest in the eleven-week dataset. It also contains the two highest individual scores observed this week, at 37 and 35.
The finding describes a concentration of measured visibility in Health-related AI responses. It does not establish why that concentration occurred or whether the same pattern would appear across all AI platforms, prompts or voters.
Insight 3: Housing Moves Above Zero, but Remains the Least Visible Domain
Housing recorded a domain-wide score of 0.0/100 in Week 10, with all six monitored party profiles returning zero. In Week 11, its average rose to 1.3/100.
The increase came from two monitored profiles:
- National: 0 to 5.
- Labour: 0 to 3.
The Green Party, NZ First, Te Pāti Māori and ACT Housing profiles remained at zero.
This small change does not alter the broader longitudinal picture. Housing continues to have the lowest average AI Visibility Score of the five monitored policy domains, and four of its six Week 11 profiles remain at zero.
A zero score does not mean that a political party has no housing policy or that its information cannot be found online. It means the particular monitored profile recorded zero on CiteCompass’s metric during the defined research period.
The continuing gap between information published online and information surfaced in these monitored AI responses remains an important question for further study.
Insight 4: Party-Level Averages Change, but Do Not Measure Political Standing
An additional way to inspect the dataset is to calculate each party’s equal-weighted average across its five monitored policy profiles.
| Political party | Week 10 | Week 11 | Change |
|---|---|---|---|
| National | 14.2 | 16.2 | +2.0 |
| Labour | 13.2 | 20.6 | +7.4 |
| Green | 15.0 | 16.2 | +1.2 |
| NZ First | 4.6 | 5.4 | +0.8 |
| Te Pāti Māori | 5.6 | 8.0 | +2.4 |
| ACT | 7.6 | 7.8 | +0.2 |
These party averages are calculated from the five published profile scores, with each policy domain contributing equally. They allow readers to observe aggregate movement, but do not provide a measure of electoral competitiveness, campaign effectiveness or policy quality.
The largest party-average increase this week was 7.4 points, and the smallest was 0.2 points. The range reinforces the importance of inspecting the underlying policy profiles rather than interpreting an average in isolation.
For example, some party averages increased despite individual policy-profile decreases. Similarly, all five domain averages increased even though seven of the 30 individual profiles declined.
Insight 5: The Highest Eleven-Week Average Still Leaves Most Profiles Below 20
The latest results bring the longitudinal picture into sharper focus.
| Reporting week | Average AI Visibility Score |
|---|---|
| Week 1 | 9.9 |
| Week 2 | 9.5 |
| Week 3 | 10.2 |
| Week 4 | 11.1 |
| Week 5 | 10.4 |
| Week 6 | 10.4 |
| Week 7 | 10.0 |
| Week 8 | 10.0 |
| Week 9 | 10.3 |
| Week 10 | 10.0 |
| Week 11 | 12.4 |
Week 11 is 2.5 points above the Week 1 baseline, at one decimal place. Yet 80% of monitored profiles remain below 20/100 and only six reach 20 or above.
The number of zero-scoring profiles has fallen from seven in Week 10 to four in Week 11. The highest individual profile score has increased from 26 to 37.
The 30-profile dataset also recorded substantial internal movement: 17 increases, seven decreases and six unchanged results. The combined absolute change of 114 score points substantially exceeds the 70-point net increase, indicating that some improvements were offset by declines elsewhere.
The result is therefore not a simple story of universally improving visibility. It is a measurable aggregate increase alongside continued concentration and variation across individual profiles.
What the Final Pre-Election Snapshot Shows
As New Zealand approaches the 2026 General Election, the eleven-week record provides five grounded observations:
- A late aggregate increase: the overall AI Visibility Score has reached its highest observed weekly average of 12.4/100.
- A broad domain-level reversal: all five policy-domain averages increased after all five declined in Week 10.
- A strong Health contribution: the Health domain accounts for more than half of the net increase in profile score points this week.
- A persistent Housing gap: Housing has risen from zero but remains the lowest-visibility domain.
- An uneven information landscape: 24 of 30 profiles remain below 20/100 despite the overall increase.
The central pre-election observation is:
Immediately before the election, measured AI visibility of political-party policy information has increased, but the availability of that information within the monitored AI research environment remains highly uneven.
This result raises questions about how generative AI retrieves, synthesises and cites political-policy information. It does not establish an effect on voting behaviour or provide evidence for choosing any political party.
What the Data Does – and Does Not – Tell Us
The AI Visibility Score is a CiteCompass research metric on a 0–100 scale, based on observed representation of monitored policy profiles within defined generative AI research activity.
It is not a measure of policy quality, political credibility, electoral support, real-world voter sentiment or likely election results.
The study is a longitudinal observational study, not a controlled experiment. Individual research queries are dynamically generated under an equivalent framework for each of the six parties, reflecting changing research needs and information conditions. Changes in scores cannot be assigned to a single campaign activity, policy update, news story or AI-system change without additional evidence.
This is the last regular report ahead of polling day. Week 12, covering 2–9 November 2026 UTC, is planned as the concluding measurement period, with the final study assessment to follow after the election.
Our Governing Research Principle
Observe. Measure. Report. Do not advocate.
CiteCompass is politically independent. This research does not endorse or oppose any political party or candidate, evaluate the merits of policies, recommend how New Zealanders should vote, or predict the result of the General Election.
All six monitored parliamentary parties are studied using the same five policy domains, equivalent persona methodology, AI-platform framework, measurement approach and reporting cadence.
About the NZ Election 2026 AI Visibility Monitor
The CiteCompass NZ Election 2026 AI Visibility Monitor is an independent 12-week longitudinal observational study examining how leading generative AI platforms surface and cite publicly available New Zealand political-party policy information.
The study monitors six parliamentary parties across five policy areas: Cost of Living; Economy, Jobs & Growth; Health; Housing; and Crime & Public Safety. Thirty party-policy profiles are measured during each reporting week.
Research information
- Week 11 reporting period: 26 October–2 November 2026 UTC.
- This report: Final weekly publication before the 7 November 2026 General Election.
- Profiles monitored: 30 (six parties × five policy areas).
- Methodology: Version 1.0.
- Read the research methodology.
- Review the Week 10 research findings.
- View the New Zealand Electoral Commission election timetable.
Source: CiteCompass NZ Election 2026 research dataset, Week 11, “Report Data Summary” and “Reporting Dates” worksheets. Averages are calculated from the published profile scores; displayed values are rounded to one decimal place.